Understanding TAM, SAM, and SOM

Last Updated: By Reyna Hurand
For any startup founder looking to launch a successful business, it’s crucial to understand your potential market size and growth opportunities. Three important metrics to measure are total addressable market (TAM), serviceable available market (SAM), and serviceable obtainable market (SOM). Understanding the differences between TAM vs SAM vs SOM will provide key insights into your startup's market potential and help focus your strategy.
TAM, SAM, and SOM Explained
Before diving into the specific calculations, it's important to clearly define these three key terms:
Total Addressable Market (TAM)
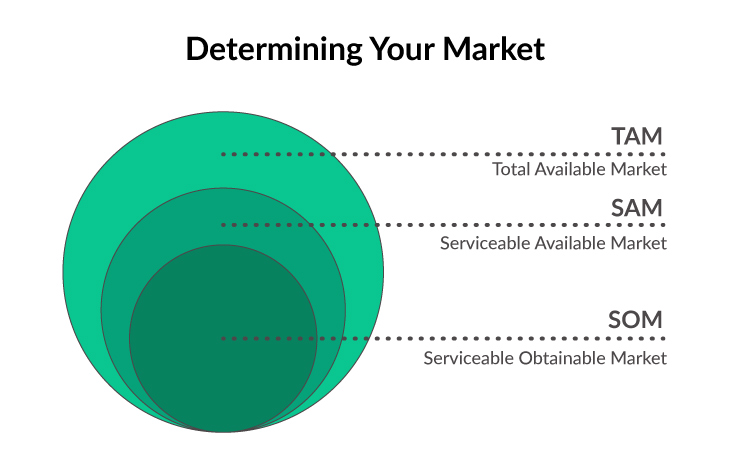
Your total addressable market refers to the total market demand for your product or service. TAM measures the overall industry revenue opportunity if 100% market share was achievable.
For example, imagine you're launching a new eco-friendly bicycle in the US. The TAM would be all the potential customers in the US interested in buying a bicycle.
TAM doesn't consider competition or product features — it assumes your startup could reach every potential customer in the market. While unattainable, estimating your TAM is an important first step to understanding your venture's potential.
Serviceable Available Market (SAM)
While TAM focuses on the total market, your serviceable available market specifically looks at the segment you target with your product and business model. SAM measures the portion of the TAM that your startup can realistically serve.
Continuing with the eco-friendly bicycle example, your SAM might be health-conscious individuals in urban areas, a subset of the entire US bicycle market. This helps estimate a more attainable market size based on your target customer, pricing, and competitive landscape.
Serviceable Obtainable Market (SOM)
Finally, the serviceable obtainable market measures the revenue opportunity that your startup can realistically capture from the SAM. Where SAM focuses on your target market, SOM looks at your expected market share within that SAM.
Factors like competition, product differentiation, marketing reach, and barriers to entry will impact the SOM. For an early-stage startup, the SOM will be a small fraction of the overall SAM. As your company grows, you'll ideally expand your SOM, taking market share from competitors.
Perhaps only three cities in the U.S. have the infrastructure and consumer interest to support significant sales of your eco-friendly bicycle. Your SOM is, therefore, the health-conscious individuals in those three cities.

Why Measure TAM, SAM, and SOM?
Together, TAM, SAM, and SOM form a holistic understanding of the market landscape. Here's why measuring these metrics is crucial for entrepreneurs:
- Validates your startup idea: Calculating your theoretical market size helps validate if your idea could support a viable, scalable business. If the TAM is too small, it may not be worth pursuing.
- Focuses product-market fit: Knowing your target customer segments and optimal distribution channels guides tactical decisions to laser focus on the most promising SAM and SOM.
- Attracts investors: Hard numbers that convincingly size your market opportunity are enticing to potential investors. This data quantifies the upside potential.
- Informs budgeting: Accurate market modeling allows you to realistically budget required expenses to capture your SOM. This prevents overspending beyond your near-term revenue potential.
- Monitors progress: Measuring these metrics on an ongoing basis serves as benchmarks to track market penetration and alerts when strategy adjustments are needed.
How to Calculate TAM, SAM, and SOM
Now let's walk through the key steps to estimating TAM, SAM, and SOM for your company. We’ll use our hypothetical eco-friendly bike startup as a case study:
Measuring TAM
First, we’ll dive into how to measure TAM and the various approaches you could use:
1. Top-Down Approach
This approach uses industry research and reports to identify the overall market size and then narrows it down to a specific segment. You can use the following formula:
TAM = (Industry Revenue or Volume) x (Target Market Segment Percentage)
So, if the overall U.S. bicycle market revenue is $6 billion, and the startup’s target market (eco-friendly bicycles) represents 10%, the TAM would be $600 million.
2. Bottom-Up Approach
This involves estimating TAM based on primary data, such as sales figures, customer interviews, and pricing. It builds the TAM from individual customer segments. The formula for this approach looks like the following:
TAM = (Number of Customers in Segment) x (Average Annual Revenue per Customer)
If there are 1 million potential eco-friendly bicycle buyers in the U.S. and the average spending per customer is $600, the TAM would be $600 million.
3. Value Theory Approach
This approach calculates the TAM by assessing the value your product or service provides to customers. It can be more subjective and considers factors like time saved, costs reduced, or other value metrics. Here’s the formula for this approach:
TAM = (Number of Customers) x (Value Provided per Customer)
If the bicycles save 500,000 commuters $1,200 annually on transportation, the TAM would be $600 million.
Additional Considerations for Calculating TAM:
- Adjust for Market Trends: Consider how market trends may influence your TAM. In the case above, the rise in environmental consciousness may expand the market over time.
- Validate with Primary Research: Complement existing data with interviews, surveys, or other primary research methods to validate and refine your TAM.
Measuring SAM
Now let’s explore how to measure and calculate SAM, continuing with our example:
1. Segmenting Your Market
First, you'll need to identify the segments within the TAM that align with your product or service offering, geographical reach, and other constraints.
The startup might target urban, health-conscious consumers within cities that have bike-friendly infrastructures.
2. Using Existing Data (Top-Down Approach)
This method involves narrowing down TAM using industry research and identifying the percentage of the market that aligns with your target segments. Here’s the formula you can use:
SAM = TAM x (Percentage of Targeted Segment)
So, if the startup’s TAM is $600 million and the target segment (urban eco-friendly bicycle enthusiasts) makes up 10% of the TAM, the SAM would be $60 million.
3. Building from Scratch (Bottom-Up Approach)
This process constructs the SAM from granular data, including pricing, customer numbers, and sales figures within your targeted segment. Here’s the formula for this method:
SAM = (Number of Customers in Targeted Segment) x (Average Annual Revenue per Customer in Segment)
If there are 100,000 potential urban eco-friendly bicycle buyers and the average spending per customer in this segment is $600, the SAM would be $60 million.
Additional Considerations for Calculating SAM:
- Customize to Your Business Model: Understand the specific needs, preferences, and behaviors of your target segment.
- Adjust for Competitors: Analyze competitors targeting the same segment to refine your SAM.
- Validate through Research: Use primary research like interviews or surveys to validate your assumptions.
Measuring SOM
Lastly, let's explore how to estimate SOM using the continued example from above:
1. Analyzing Market Constraints
Assess the existing competition, market saturation, regulatory environment, and your startup's current resources and capabilities.
The company might analyze competitors in the urban eco-friendly bicycle market and evaluate its production capacity and marketing reach.
2. Applying Market Share Estimates (Top-Down Approach)
Based on your unique value propositions (UVPs), competition, and market trends, estimate the percentage of the SAM you can realistically obtain using the following formula:
SOM = SAM x (Estimated Market Share Percentage)
So, if the bike company’s SAM is $60 million and they estimate capturing 5% of this market in the first three years, the SOM would be $3 million.
3. Detailed Sales Forecasting (Bottom-Up Approach)
Construct the SOM by projecting sales volume, pricing strategies, customer acquisition rates, and other sales-specific factors. You can use the formula below:
SOM = (Projected Sales Volume) x (Average Price per Unit)
If the startup plans to sell 5,000 bicycles in three major cities at an average price of $600, the SOM would be $3 million.
Additional Considerations for Calculating SOM:
- Alignment With Business Goals: Ensure that the SOM aligns with your startup's short- and medium-term goals and strategies.
- Realistic Assessment: Consider your current resources, including staff, budget, and production capabilities. Being overly optimistic may lead to overextension.
- Monitor and Adjust: Continuously monitor your actual market share against your SOM and adjust strategies accordingly.
Bottom Line
Carefully researching and estimating your TAM, SAM, and SOM can provide invaluable insight into whether your startup idea has merit and what strategies you should pursue to be successful. A large TAM signals a major opportunity, but only if your SAM and SOM are also substantial. It is wise to be conservative in your assessments to account for overestimations of market potential.
Regularly reevaluating TAM, SAM, and SOM metrics can help track whether your assumptions are on target and determine if any adjustments in strategy are needed. While not perfect indicators, understanding and applying these sizing metrics can better position an entrepreneur to capitalize on the right opportunities.


